-
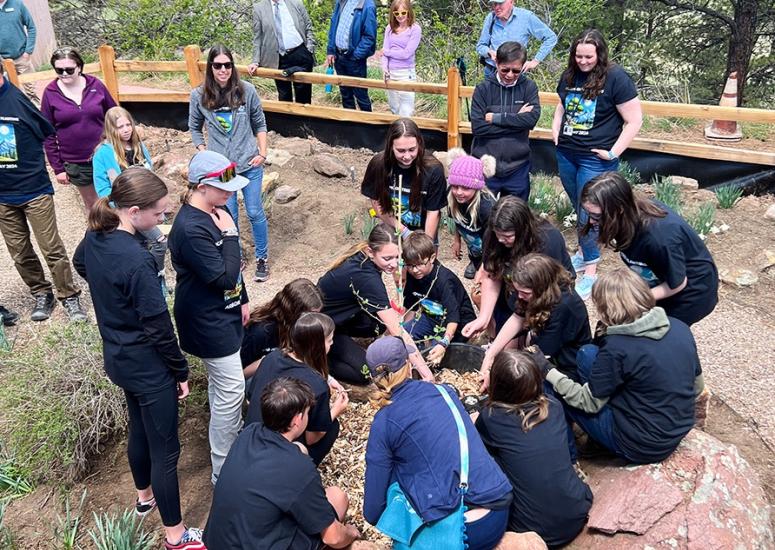
Moon Tree descendant lands at NSF NCAR
Students from St. Vrain Valley School District helped plant a second-generation Apollo Moon Tree on the campus of the U.S. National Science Foundation National Center for Atmospheric Research (NSF NCAR) during an Arbor Day ceremony on April 26, 2024. The American Sycamore sapling will serve as a reminder to the community of the importance of scientific exploration.
- Education + Outreach
-
Asian monsoon lofts ozone-depleting substances to stratosphere
The increasingly powerful winds of the East Asian Monsoon are are lofting unexpectedly large quantities of ozone-depleting substances high into the atmosphere.
- Climate
-

Renee Sneed named new UCAR Chief Human Resources Officer
Sneed will help lead efforts already underway to help UCAR transform its HR services in response to a changing internal and external landscape.
- Organization
-
Fires pose growing worldwide threat to wildland-urban interface
Fires that burn through the wildland-urban interface are becoming more frequent worldwide, and the trend is likely to continue.
- Air Quality
-
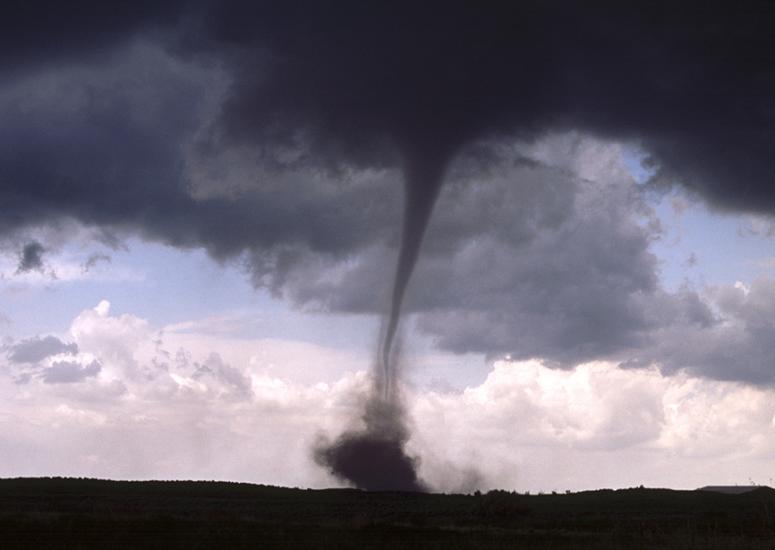
Experts available to discuss tornadoes
As tornado season ramps up, scientists at the U.S. National Science Foundation National Center for Atmospheric Research (NSF NCAR) are available to talk with journalists about various issues related to tornadoes.
- Weather