-
Fires pose growing worldwide threat to wildland-urban interface
Fires that burn through the wildland-urban interface are becoming more frequent worldwide, and the trend is likely to continue.
- Air Quality
-
Renee Sneed named new UCAR Chief Human Resources Officer
Sneed will help lead efforts already underway to help UCAR transform its HR services in response to a changing internal and external landscape.
- Organization
-
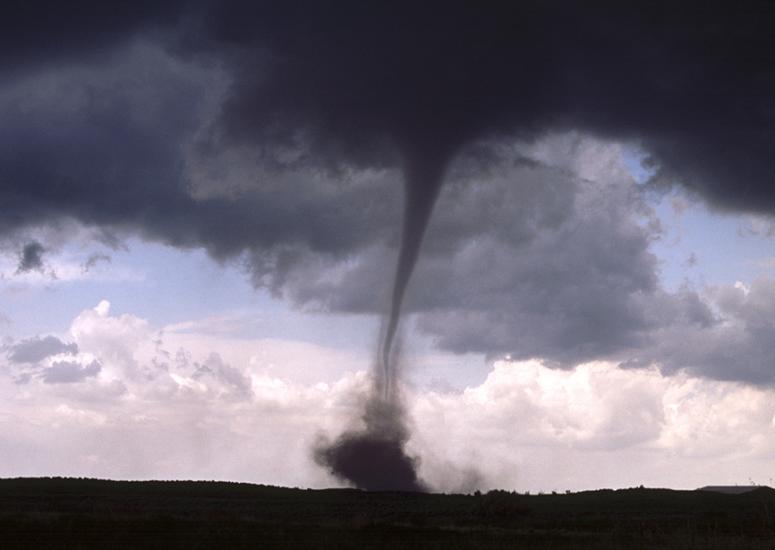
Experts available to discuss tornadoes
As tornado season ramps up, scientists at the U.S. National Science Foundation National Center for Atmospheric Research (NSF NCAR) are available to talk with journalists about various issues related to tornadoes.
- Weather
-
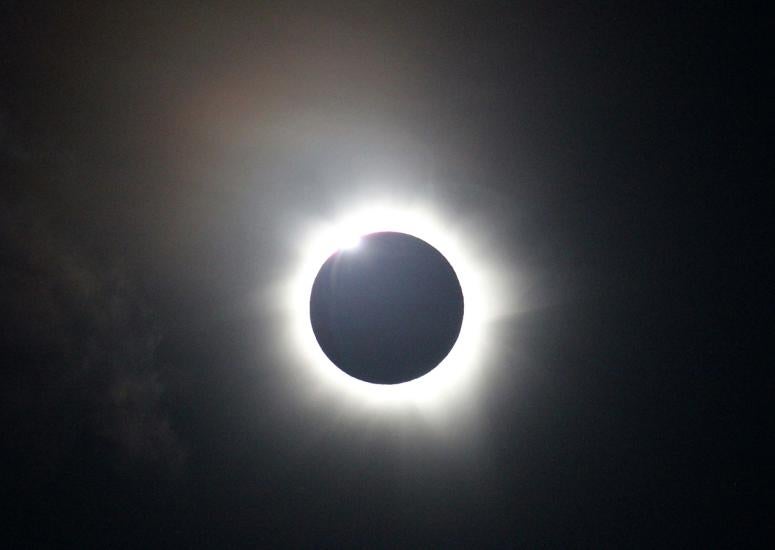
Total eclipse: celestial wonder and scientific opportunity
As the April 8, 2024 total eclipse approaches, scientists and staff with the U.S. National Science Foundation National Center for Atmospheric Research (NSF NCAR) are preparing a variety of experiments and outreach projects to further our knowledge of the Sun and engage various communities in observing and understanding this extraordinary and rare event.
- Sun + Space Weather
-
Experts available to discuss atmospheric rivers
Experts at NSF NCAR are available to talk with reporters about a number of aspects of atmospheric rivers.
- Climate,
- Weather